


Crypto market analysis is a critical skill for advisors in the fast-paced world of digital assets. At Web3 Enabler, we’ve seen firsthand how thorough analysis can lead to better decision-making and client outcomes.
This post will guide you through the essential components of effective crypto market analysis, from understanding the landscape to leveraging key metrics and tools. By mastering these techniques, you’ll be better equipped to navigate the complexities of the crypto market and provide valuable insights to your clients.
What Drives the Crypto Market?
Key Players and Major Cryptocurrencies
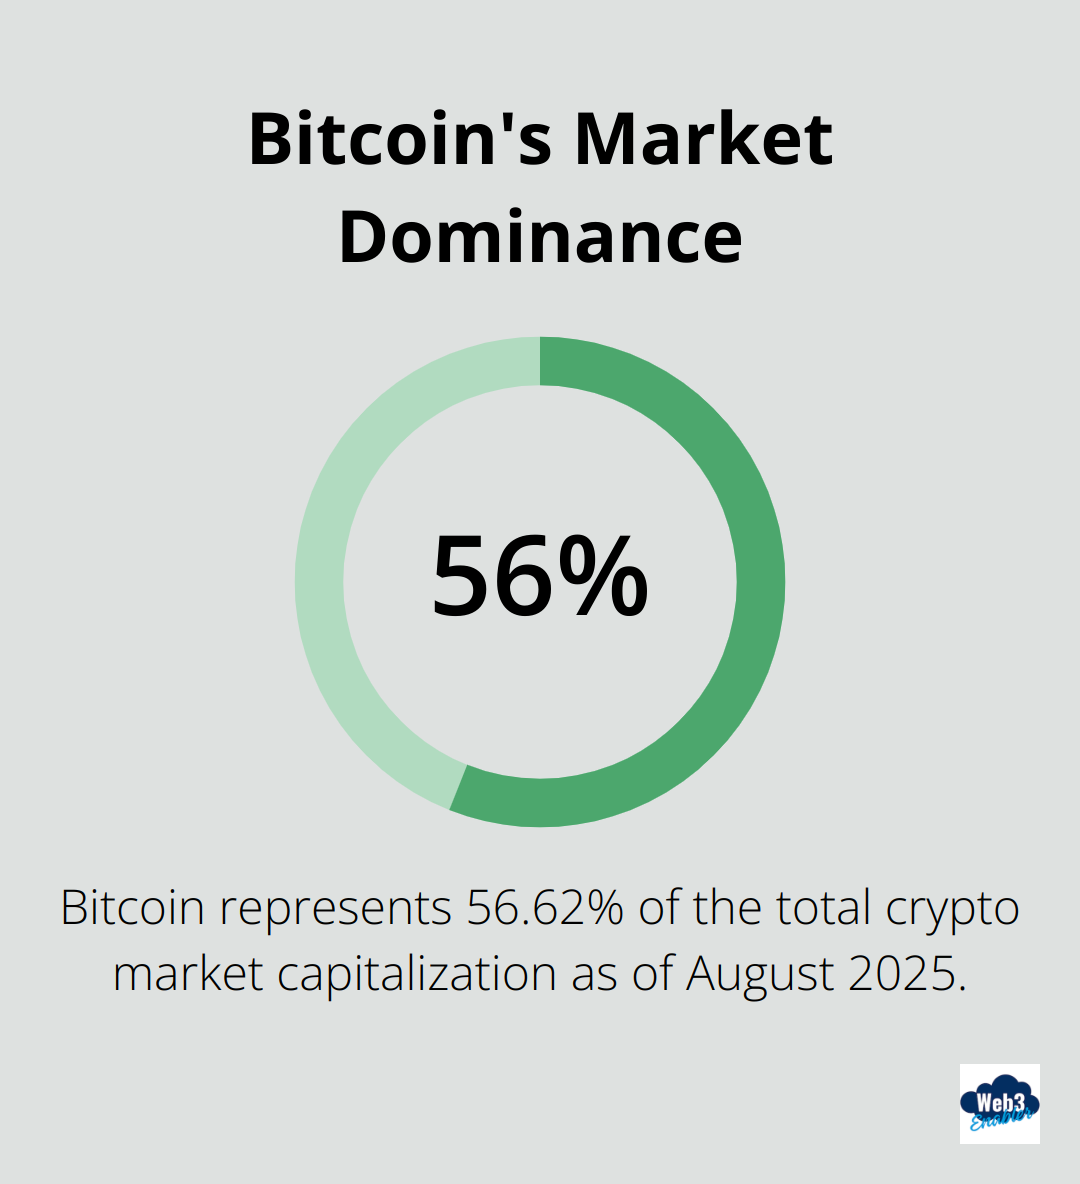
The crypto market landscape is dominated by Bitcoin (BTC), which represents 56.62% of the total market capitalization as of August 2025. However, the emergence of Layer 2 solutions and alternative Layer 1 blockchains has introduced diversity to the market. Solana, Cardano, and Polkadot have gained significant traction, each offering unique features that cater to different market segments.
Institutional players now wield considerable influence. BlackRock’s Bitcoin ETF, launched in 2024, currently holds over $10 billion in assets under management. This institutional adoption has contributed to increased stability in Bitcoin’s price, reducing its notorious volatility.
Market Dynamics
Trading volume serves as a critical indicator of market health. In 2025, the daily trading volume across major exchanges averages $150 billion, with spikes occurring during significant market events. This liquidity facilitates easier entry and exit points for large investors.
Stablecoins play a pivotal role in market dynamics. USDC and USDT facilitate quick trades and serve as a safe haven during market turbulence. Web3 Enabler has integrated stablecoin payments into its solutions, recognizing their growing importance in the crypto ecosystem.
Regulatory Landscape
The regulatory environment significantly impacts market behavior. The SEC’s approval of spot Bitcoin ETFs in 2024 marked a turning point, leading to increased institutional participation. However, the global regulatory landscape remains fragmented.
The EU’s Markets in Crypto-Assets (MiCA) regulation, fully implemented in 2025, has set a benchmark for crypto regulation worldwide. It has provided clarity for businesses operating in the EU, leading to increased adoption of crypto services.
In the US, the GENIUS Act bill passed in July 2025 has legitimized USD-pegged stablecoins, leading to their increased use in cross-border transactions. This regulatory clarity has boosted businesses leveraging stablecoins for payments (a key focus area for Web3 Enabler).
Market Trends and Innovations
The crypto market continues to evolve rapidly, with new trends and innovations emerging regularly. Decentralized Finance (DeFi) protocols have grown exponentially, with Total Value Locked (TVL) reaching $500 billion in 2025. This growth has attracted both retail and institutional investors seeking higher yields and innovative financial products.
Non-Fungible Tokens (NFTs) have expanded beyond digital art, finding applications in real estate, identity verification, and supply chain management. This diversification has opened up new opportunities for businesses to leverage blockchain technology in various sectors.
The rise of Web3 technologies has also influenced the crypto market. Decentralized social media platforms and blockchain-based gaming (GameFi) have gained traction, creating new economic models and investment opportunities.
As we move forward, understanding these market drivers becomes essential for effective crypto market analysis. The next section will explore the tools and techniques that can help you navigate this complex landscape and provide valuable insights to your clients.
Mastering Crypto Analysis Tools
At Web3 Enabler, we’ve observed how the right tools can significantly enhance crypto market analysis. This chapter explores essential tools that will sharpen your analytical edge.
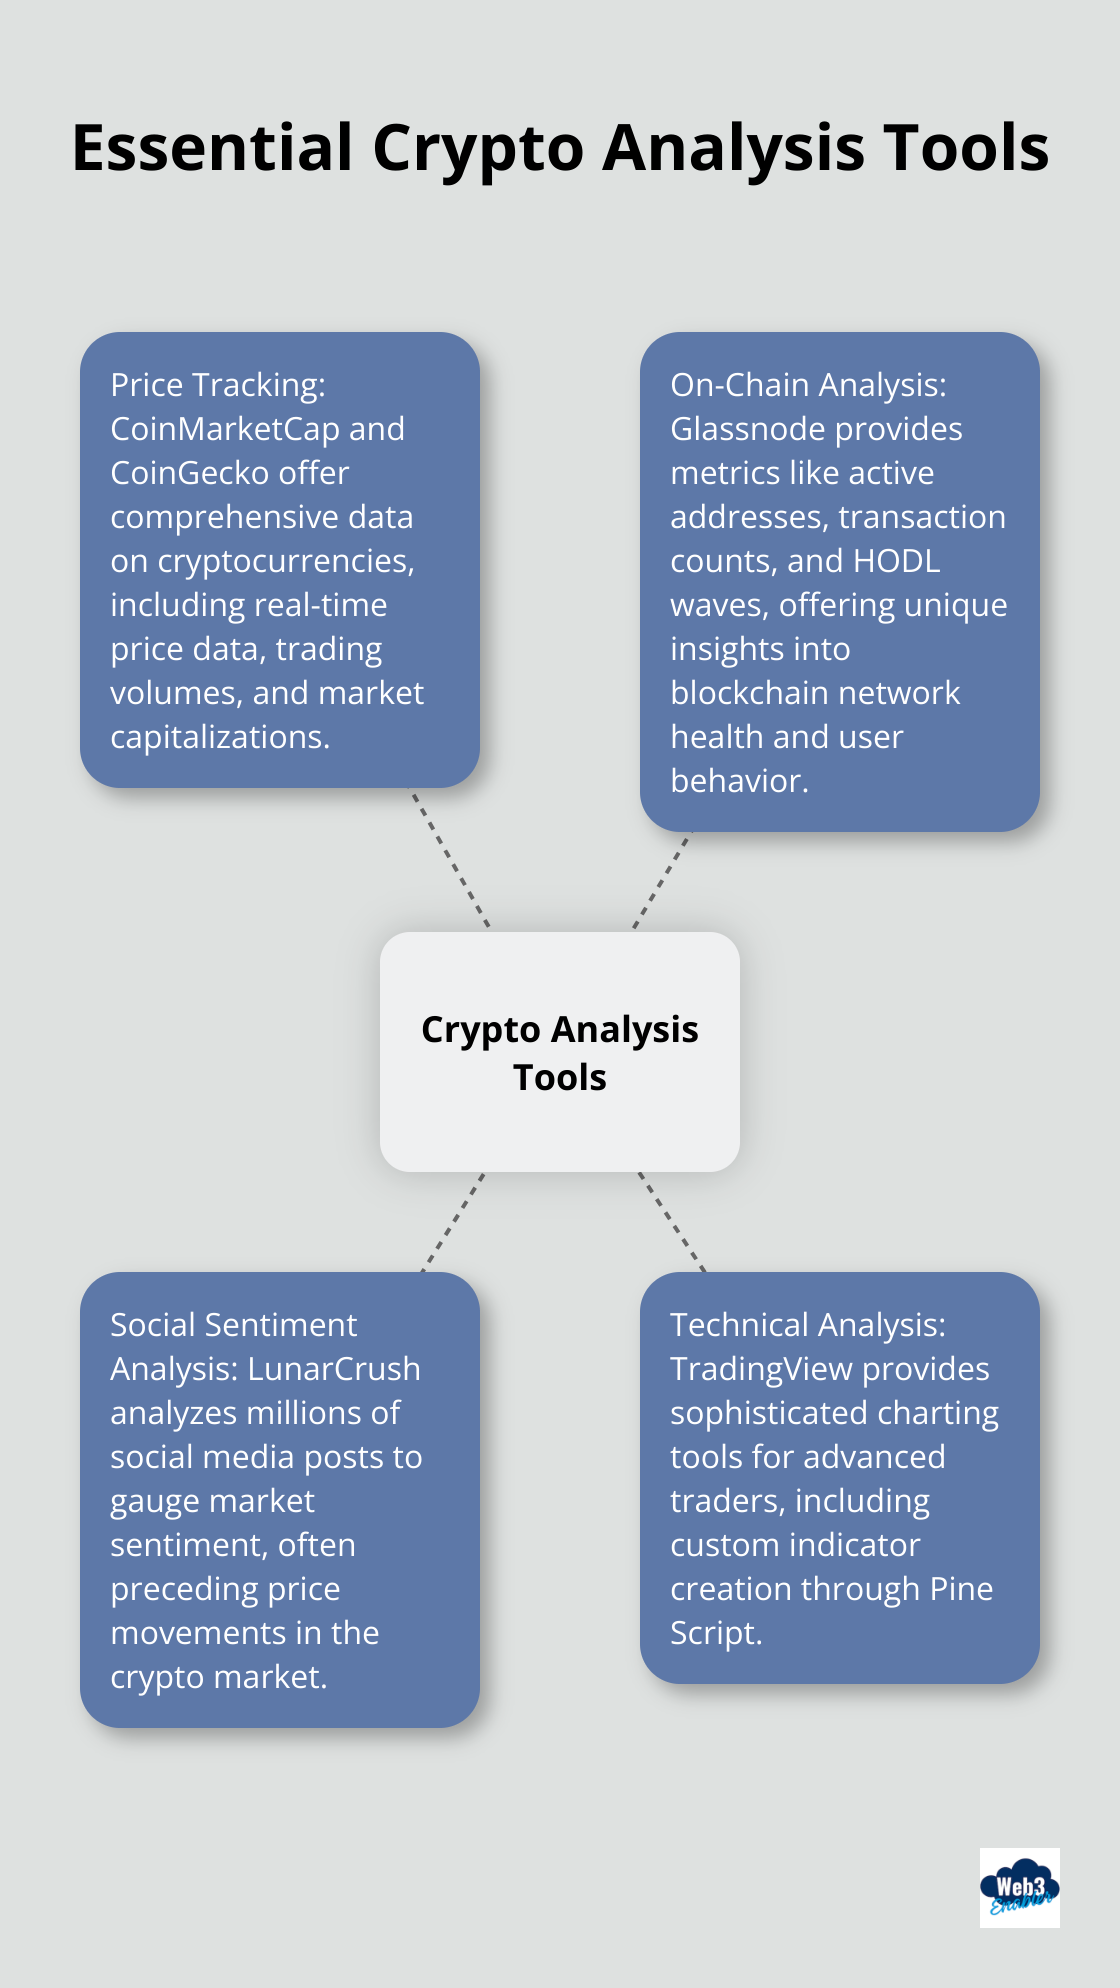
Price Tracking and APIs
CoinMarketCap and CoinGecko serve as industry standards for price tracking. These platforms offer comprehensive data on cryptocurrencies, including real-time price data, trading volumes, and market capitalizations. Their APIs allow for seamless integration of real-time data into analysis workflows.
TradingView provides sophisticated charting tools for advanced traders. Its scripting language, Pine Script, enables custom indicator creation.
On-Chain Analysis
On-chain analysis tools offer unique insights into blockchain network health and user behavior. Glassnode excels in this category, providing metrics like active addresses, transaction counts, and HODL waves.
The Net Unrealized Profit/Loss (NUPL) metric proves particularly useful. A positive NUPL indicates that the network as a whole is in profit.
Nansen specializes in Ethereum and ERC-20 token analysis, categorizing wallet addresses to identify smart money movements.
Social Sentiment Analysis
Social sentiment often precedes price movements in the crypto market. LunarCrush analyzes millions of social media posts to gauge market sentiment.
The Crypto Fear & Greed Index offers a quick snapshot of market sentiment. It aggregates various data points into a single number between 0 and 100 (where 0 represents extreme fear and 100 represents extreme greed).
Integrating Analysis Tools
The combination of multiple data sources forms a comprehensive analysis. No single tool provides a complete picture of the crypto market. Financial advisors can benefit from integrating these tools into their existing workflows.
Web3 Enabler’s platform allows seamless integration with many of these analysis tools, providing a unified interface for comprehensive market analysis. This integration empowers advisors to make data-driven decisions and offer valuable insights to their clients.
The next chapter will explore key metrics and indicators that advisors should monitor when conducting crypto market analysis.
What Key Metrics Drive Crypto Market Decisions?
Technical Indicators: The Market’s Pulse
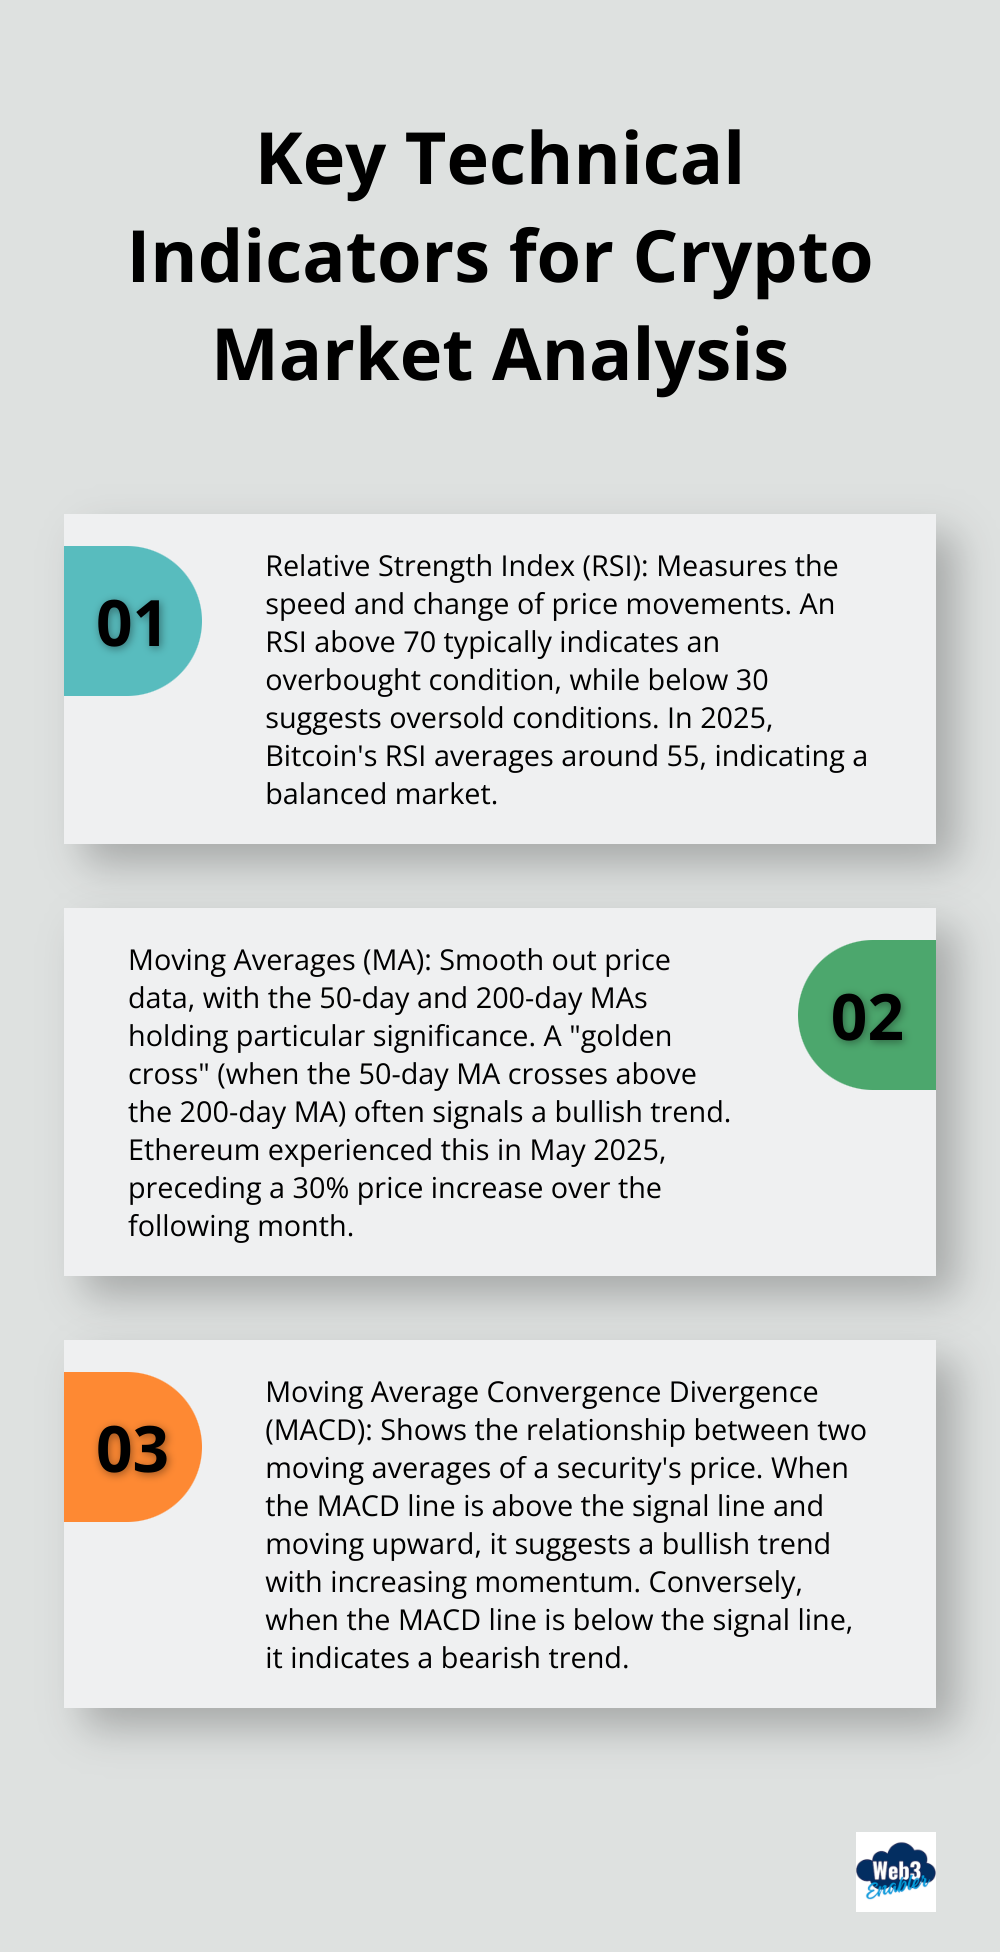
The Relative Strength Index (RSI) measures the speed and change of price movements. An RSI above 70 typically indicates an overbought condition, while below 30 suggests oversold conditions. In 2025, Bitcoin’s RSI averages around 55, indicating a balanced market.
Moving Averages (MA) smooth out price data. The 50-day and 200-day MAs hold particular significance. A “golden cross” (when the 50-day MA crosses above the 200-day MA) often signals a bullish trend. Ethereum experienced this in May 2025, preceding a 30% price increase over the following month.
The Moving Average Convergence Divergence (MACD) shows the relationship between two moving averages of a security’s price. When the MACD line is above the signal line and moving upward, it suggests a bullish trend with increasing momentum. Conversely, when the MACD line is below the signal line, it indicates a bearish trend.
Fundamental Analysis: Beyond the Charts
Market capitalization assesses a cryptocurrency’s overall value and stability. As of August 2025, the total crypto market cap stands at $4.5 trillion, with Bitcoin accounting for $2.5 trillion.
The stock-to-flow model (popularized by PlanB) reliably indicates Bitcoin’s long-term price trends. This model predicts a Bitcoin price of $288,000 by 2024, based on its scarcity relative to production.
Developer activity indicates a project’s health and potential for innovation. GitHub commits and the number of active developers serve as key metrics. Polkadot leads in this metric for 2025, with over 500 active developers working on its ecosystem.
On-Chain Metrics: Blockchain’s Hidden Insights
Active addresses provide insight into network usage and adoption. Ethereum’s daily active addresses have grown by 25% in 2025 (reaching an average of 1.2 million), indicating increased network activity and potential price appreciation.
Transaction volume serves as another key on-chain metric. Bitcoin’s average daily transaction volume in 2025 is $45 billion (up 50% from 2024). This increase suggests growing adoption and liquidity in the market.
The Network Value to Transactions (NVT) ratio, often called the “crypto P/E ratio,” can indicate whether a cryptocurrency is overvalued. A high NVT suggests overvaluation, while a low NVT might indicate undervaluation. As of August 2025, Bitcoin’s NVT ratio stands at 45, suggesting a relatively balanced valuation.
These metrics provide a comprehensive view of the crypto market. However, no single metric tells the whole story. Successful crypto market analysis requires a holistic approach, combining various indicators and adapting to the market’s evolving nature.
Final Thoughts
Crypto market analysis requires a comprehensive approach. Financial advisors must combine technical indicators, fundamental analysis, and on-chain metrics to gain accurate market insights. This integrated method enables more precise predictions and informed decision-making for clients.
The crypto space evolves rapidly, with new technologies and regulations emerging constantly. Advisors need to update their knowledge regularly and explore new analysis tools to stay ahead. This commitment to continuous learning allows them to provide valuable insights and navigate the volatile crypto landscape effectively.
Web3 Enabler offers powerful blockchain integration solutions to streamline crypto data analysis. Our tools help financial professionals incorporate cutting-edge technology into their workflows. As cryptocurrency becomes increasingly intertwined with finance, mastering these analytical techniques will position advisors as indispensable guides in the new financial landscape.